In this post I want to take a bit of a look at the way we have gone about making our Chilterns AONB LiDAR survey available for everyone to look at, and the project open for everyone to participate. I’ll talk about how we went about designing and building the portal for making our data publicly viewable, and then talk about how it has been used since we had our full launch roughly 9 months ago, on 12th August 2019. (All stats given are current at the time of writing, but are constantly ticking up!)
When Dr Wendy Morrison and I started in post in 2018, we already had a catalogue of plans that the development phase of this National Lottery Funded project had set out. We knew we were going to be flying a very large LiDAR survey, and we knew we were going to use volunteers to help look at the data as an outreach activity. Our project brief actually stated that we were to provide printed PDFs of the LiDAR imagery for volunteers to look at.
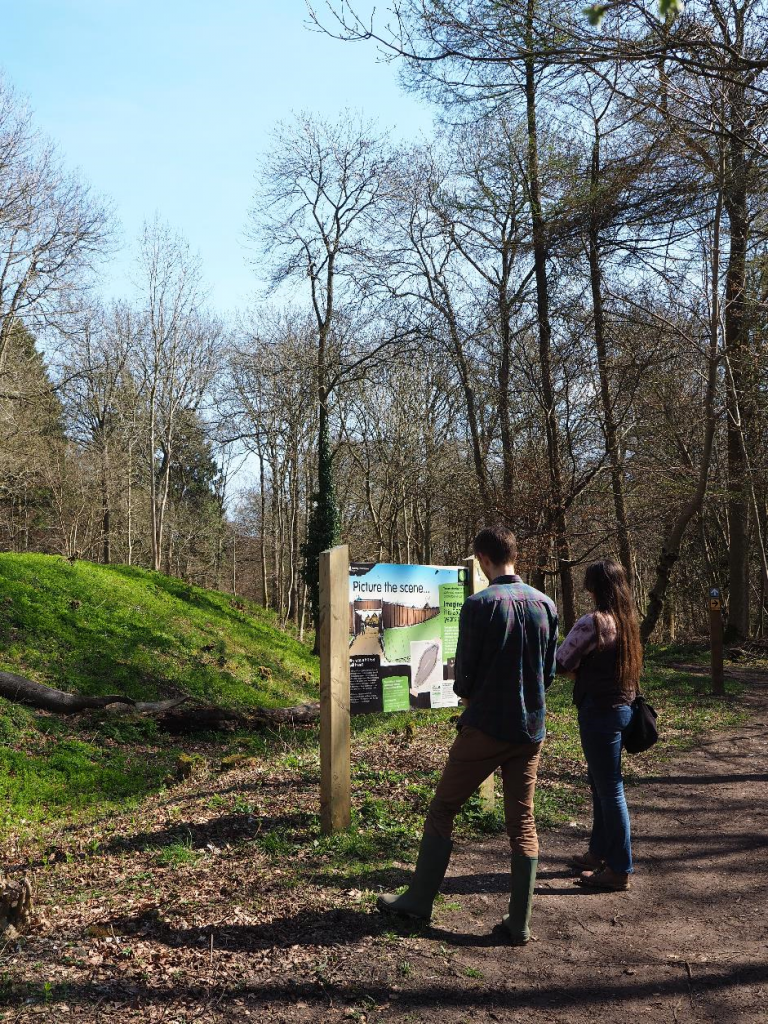
Wendy and I on what was, if I remember correctly, our very first visit to a Chilterns hillfort (Boddington Camp, Wendover Woods) just a week or two into the job.
© Chilterns Conservation Board
We thought we could do a bit better than that, not just by expanding the survey by almost a third to 1400 km2 (the largest yet flown for archaeology in the UK!), but in terms of both engagement with our audience, and in terms of better analysing the data. Two pieces of work I think were particularly influential in the direction we took in working towards this. Firstly, the work of the New Forest National Park Authority and Lawrence Shaw with their LiDAR study, which has made fantastic use of volunteers in a whole host of ways for years (I first heard Lawrence talk about his work at the CAA UK Conference in Oxford in 2014). Secondly, an (open access) paper by Gary Duckers in Internet Archaeology entitled “Bridging the Geospatial Divide in Archaeology: Community Based Interpretation of LiDAR Data,” https://doi.org/10.11141/ia.35.10. Two core principles came to the fore in our minds: open access to data, and involving the community in what we were doing as heavily as we could, because they would know the landscape far better than we could ever hope to. Some simple flat PDFs weren’t going to cut it, and so the plan to put the LiDAR online for “Citizen Science” analysis was born.
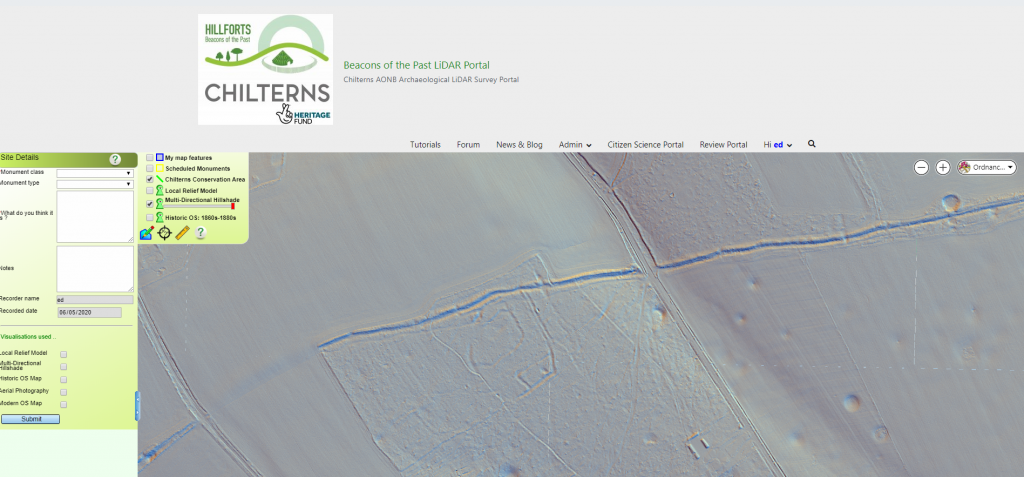
We spent a bit of time researching Citizen Science platforms that were already out there, with Zooniverse seeming to be the most popular and accessible. However, there was a problem with this system, in that it didn’t allow imagery to be presented with a spatial context, i.e. in its real world location, with the contextual information of basemapping that is necessary for interpreting the LiDAR data. So we opted for something rather more exciting – developing our own bespoke system to do something that we hadn’t seen before in the world of LiDAR analysis: presenting LiDAR data openly to the public, in geospatial context, with multiple options for basemapping (including modern high resolution mapping, historic mapping, and aerial imagery), and with the opportunity for the public to contribute their thoughts on what they were looking at. We are very grateful to our developer, Steve Smith of Go Studio, who has done a fantastic job of turning our vision into a reality, from the initial concept and building the bare bones of the two systems of the Citizen Portal and the Review Portal, through the many months of tweaking, refinements, and bug fixing that has followed! It has certainly been a big job.
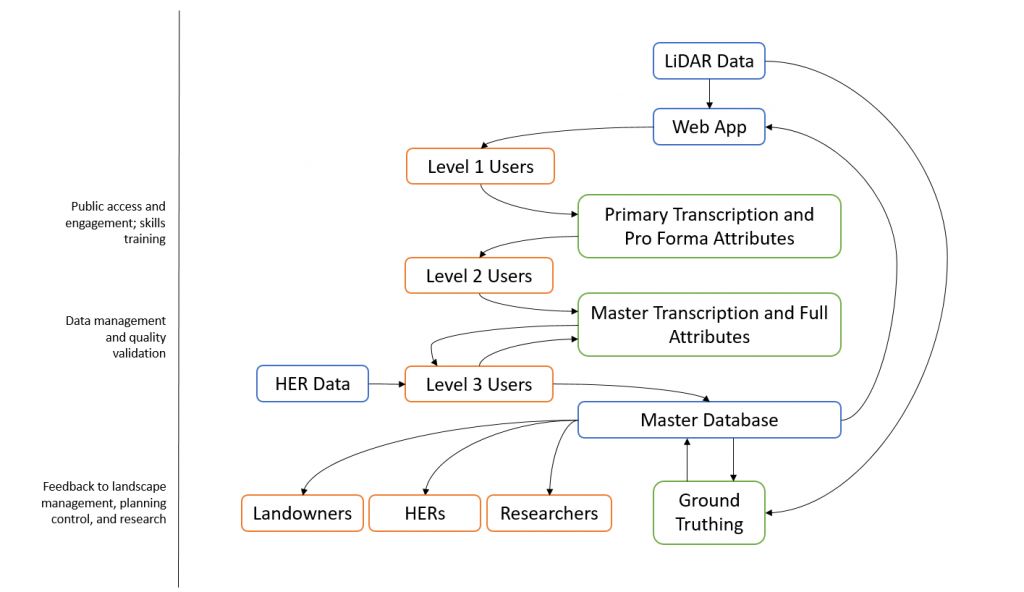
A key element to the project’s use of Citizen Science is this double system of “Citizen Portal” and “Review Portal.” I’ve written about this elsewhere, but the basic premise is that in order to audit the thousands of Citizen Portal records coming in, which will by their nature be of variable quality,
more experienced volunteers work in the second Portal to decide which records are “accepted” into the final Master Database. This database has to be of high quality so that it is of use to our end users: the County Historic Environment Records (HERs), land owners and managers, and researchers.
How well has it worked? We’re pretty ecstatic with how things have gone! Since we launched in August 2019 we have had over 2000 users register on the portal. That headline number needs some qualification: as you might expect, only a proportion of those total registrations have gone on to spend any real time working on it. Just under 800 users went on to spend time on the portal; 340 spent at least 1 hour online; just over 300 have completed at least one of the tutorials, and 166 created at least one feature. In total our Citizen Scientists have put in over 1,750 hours of time on the portal, or just shy of 73 days, or 10 and a half weeks of continuous work! That’s the same as me sitting here for 233 standard 7.5 hour work days looking at the data… so I’m very grateful!
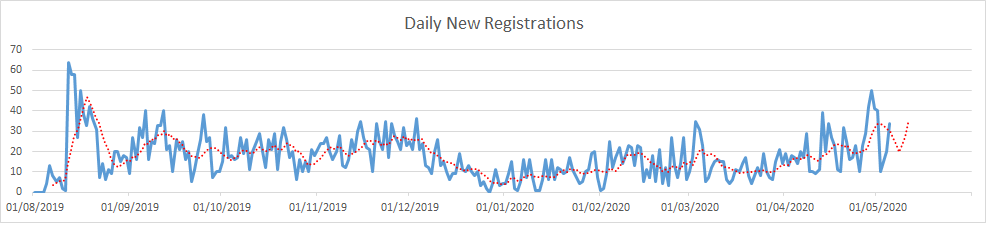
New registrations, as you might expect, saw their peak (to date…) on the day of official public launch, 12th August, with 64 registrations. The second highest number of new registrations in a day, perhaps interestingly, was 50 new sign ups on Wednesday 29th April, just a couple of weeks ago. I don’t know what caused this! Perhaps COVID-19 lockdown driving people to find new hobbies and learn new things… However, I don’t fully trust these data, as the total number of new registrations doesn’t match the number of people actually registered… whether this is a result of people deleting accounts, because of spurious “bots” trying to log in to sell us academic essay writing services (really, these are the most common spam posts that get blocked from the blog…), or people just changing passwords and my stats not quite figuring that out!
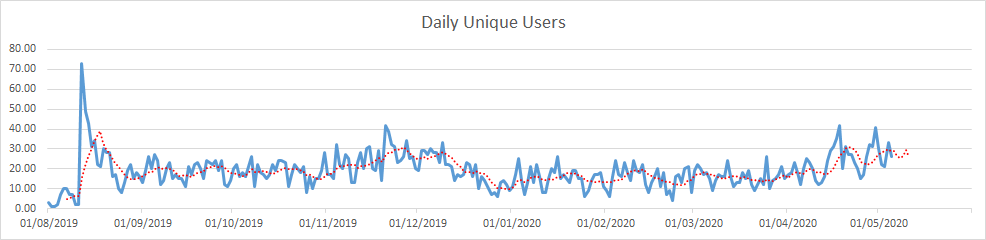
A graph of unique users logging into the portal per day, between 1st August 2019 and 5th May 2020. The red line represents a 7 day moving average.
If we look at the numbers of unique users logging on per day, the highest to date is again launch day, with 73 unique users logging in to use the portal (if you’re wondering why this is higher than launch day new registrations, it’s because we had a small team of beta testers already registered). Other peaks occurred on 20th and 21st November with 42 and 39 unique users on those days respectively, and last month on the 18th April and 30th April when 42 different people logged in on both days.
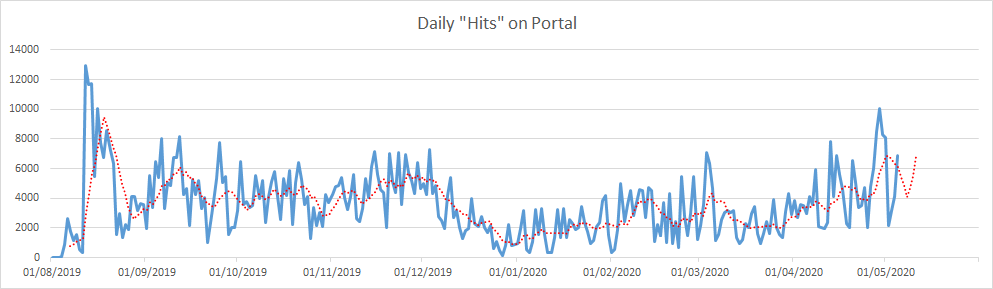
A graph of “work” on the portal per day, measured by proxy through “hits” on the website, between 1st August 2019 and 5th May 2020. The red line represents a 7 day moving average.
“Work” on portal can be measured by proxy as “hits” i.e. buttons clicked, pages loaded etc.. Again we see the highest peak on launch day, 12th August, but further periods of high activity took place in September, November, March and April. Saturdays, and to a lesser extent Sundays, always seem to have much lower levels of activity than weekdays: Saturdays have seen just 9.9% of the total work and Sundays 10.5% of the work – if “hits” were spread equally across the week we would expect each day to have an equal 14.3% portion, one seventh. Mondays, Tuesdays, and Wednesdays have all seen above average portions of the total work, at 16.3%, 17.0%, and 17.0% respectively… so clearly the first half of the week are the days for Citizen Science and LiDAR!
With all these clicks, our Citizens have created 8336 citizen records of possible archaeological sites. Join me in the next post as we look at what patterns are emerging from those records….
We hope you are staying safe and well. We are continuing with our free online training sessions and Mapathons if you want something to do – we’ve had over 130 attendees since lockdown begun, joining from countries around the world including Turkey, Germany, Saudi Arabia, and the USA! Check out this thread where I post upcoming sessions:
https://chilternsbeacons.org/wp/community/welcome/project-news/#post-872