
A frequent question I receive: “can we see what other people have recorded, so I know where to look?” A bit of discussion here on that question, and a map to show you where people have found things, and where people might not yet have looked very much…
We took a decision early on in the creation of the Citizen Portal not to make the complete sum of citizen finds visible on the portal. There were a number of reasons behind this.
- Firstly, from the point of view of conducting a “citizen science” experiment we didn’t want new users to be unduly influenced by the records that earlier recorders had created. We wanted to allow everyone to offer their own, relatively unbiased views of the data, to hear their voices de novo. If visible, those existing early records might be taken as a “model” by new users, assumed to be gospel truth. A few early inaccurate records might result in many more inaccurate records, or a restriction in the types of features being found to just those ones identified early on.
- Secondly, very importantly, we do not want to draw close attention to newly discovered sites which might then put them at increased risk of looting. The damage done every year to British archaeological sites
by thieves, and the resultant destruction and loss of information, is sadly large, as recently talked about in this Guardian article. - Thirdly, having all of the Citizen Records visible on the screen would make looking at the data rather difficult! With over 9000 records now created, it would become very difficult to identify in small, busy areas, what had already been recorded and what hadn’t.
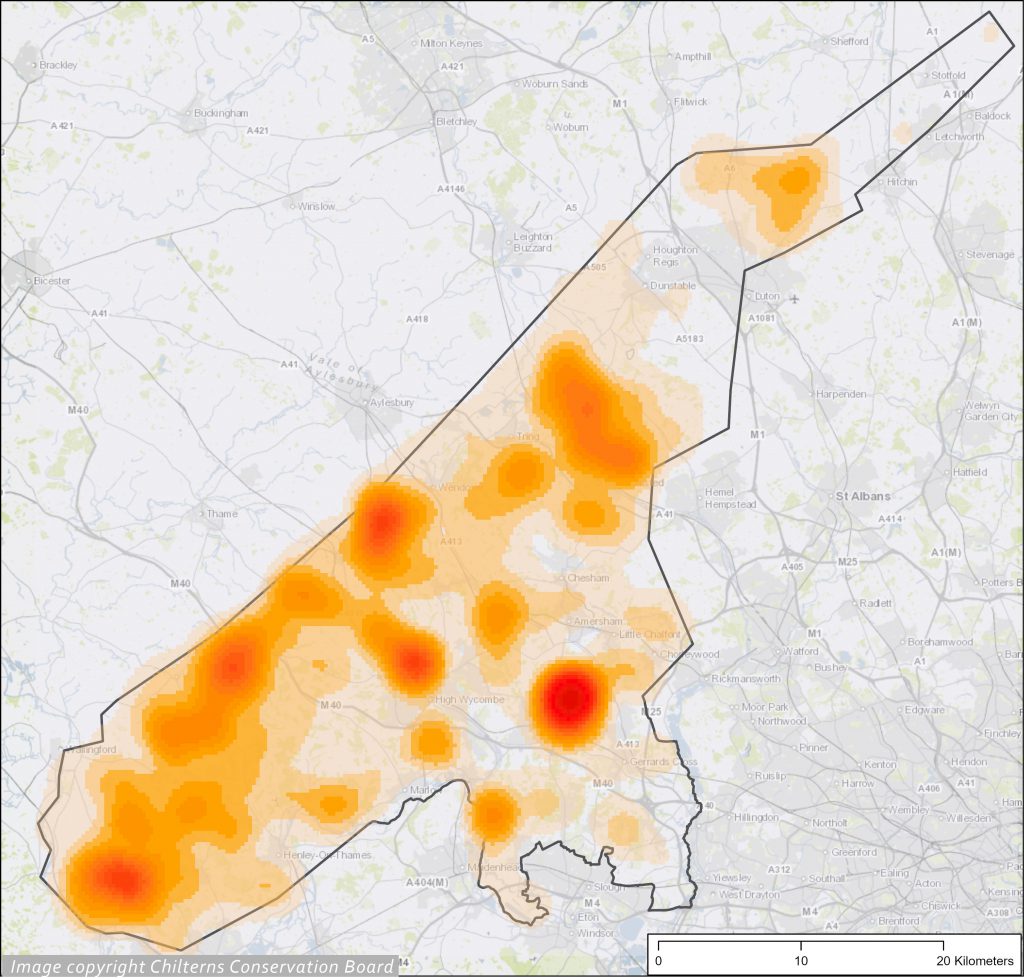
We were keen that everyone got to have their own go at looking at the dataset uninfluenced by those who had gone before; we wanted everyone to feel like they could search any part of it, not being steered away from offering their opinion of an area just because someone else had looked there first. We are now just over 9 months into the use of the portal, and as discussed in a previous blog post, we can see strong patterns emerging, reflecting which parts of the dataset have been looked at more frequently.
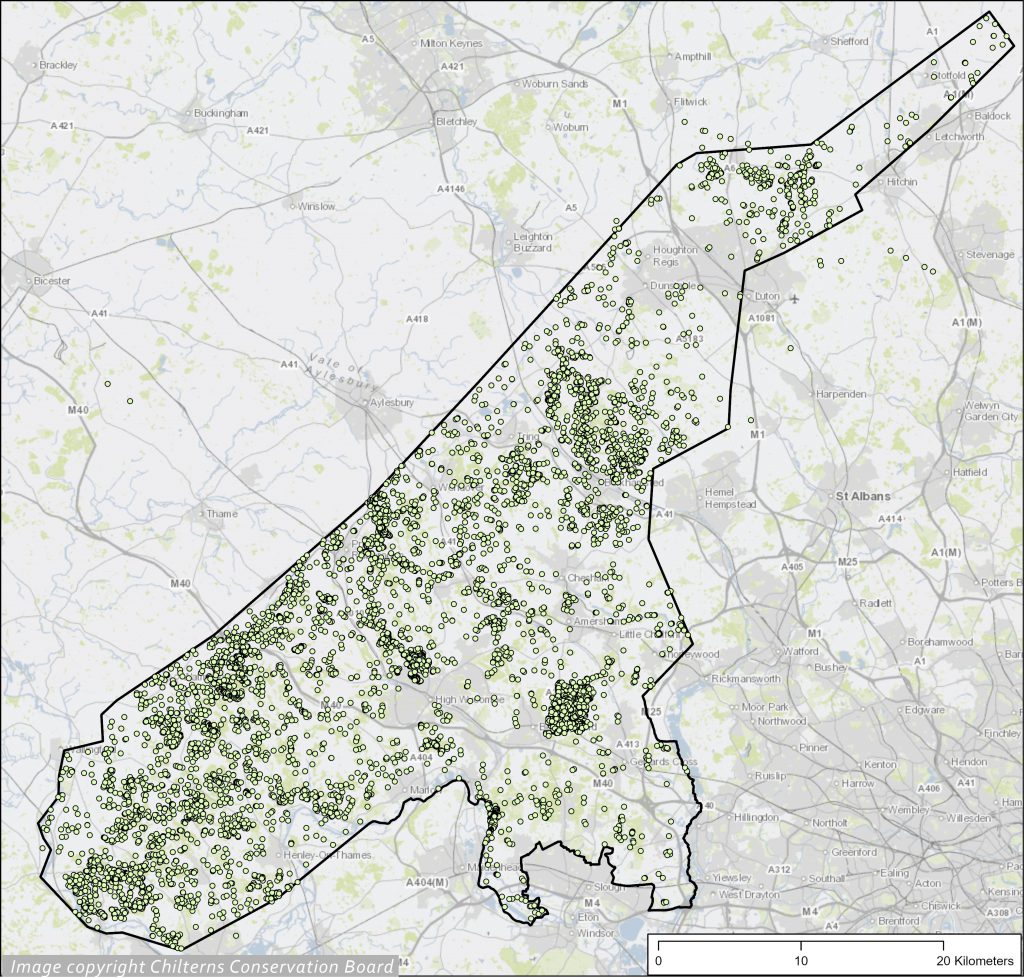
As discussed in that blog post here the pattern is very much one of where people have looked, far more than it is a pattern showing where the archaeology is. Of course some parts of the map may be “empty” of records because there is nothing to see; urban areas, for example, will have very few extant archaeological earthwork features detectable in LiDAR. But other parts are empty because fewer people have looked and worked there.
So, to finally answer that question, of “where should I look?” I’ve produced a map showing the number of records found per OS grid square (based on each record’s centroid), which can be accessed here: https://arcg.is/0T940y0 or by clicking on the image below.
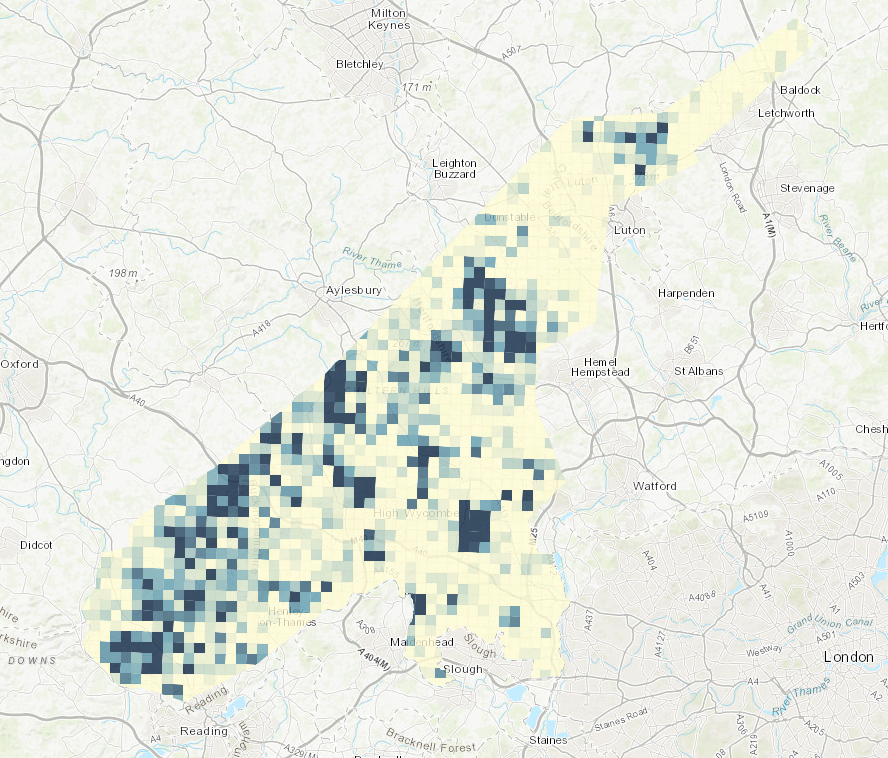
Blue grid squares have seen more citizen records created, cream ones very few or none. Zoom into the map and click on squares to find out their grid reference and how many citizen records have been recorded within them.
So, if you’re one of those people who has been asking this question, I hope this gives you some help – happy searching!
Thank you for this post. I have only just begun, and you’ve answered my questions very clearly. Appreciate the maps.
Is there a chance that the maps could be updated for 2021? Thanks!