How is it July already? No matter: we’re still having great fun exploring all the archaeology that can be found in the Chilterns LiDAR survey. 626 new Citizen Records were created in June alone, along with 481 new Monument Records from our Reviewers… of course what this means (besides lots of fantastic work continuing – thank you!) is that we need more Reviewers!! Do check out the upcoming training sessions if you want to upgrade to get access to the full set of Citizen Records and help turn them into our Master Monument Database.
But today’s blog is actually about going outside of the Chilterns landscape. (If you’re going to read on, you must first make a promise that you’ll come back to our little Chilterns survey once you’ve had fun fooling around with other datasets.) Earlier this week I held a Zoom workshop to explore how to make archaeological use of LiDAR data that is available in the wider world, in England, Scotland, and beyond (I believe Belgium was mentioned…).
(If you want to skip reading and go straight to a recording of that workshop, here you go! Video below, and PDF of the powerpoint can be viewed here)
The Chilterns LiDAR survey, covering 1400 km2, and at 25 cm resolution, is the largest “high resolution” survey yet flown for archaeology in this country. But what you may or may not know is that there are in fact thousands and thousands of square kilometres of LiDAR data out there, open access, free, and relatively straightforward to use for exploring other landscapes for archaeological remains.
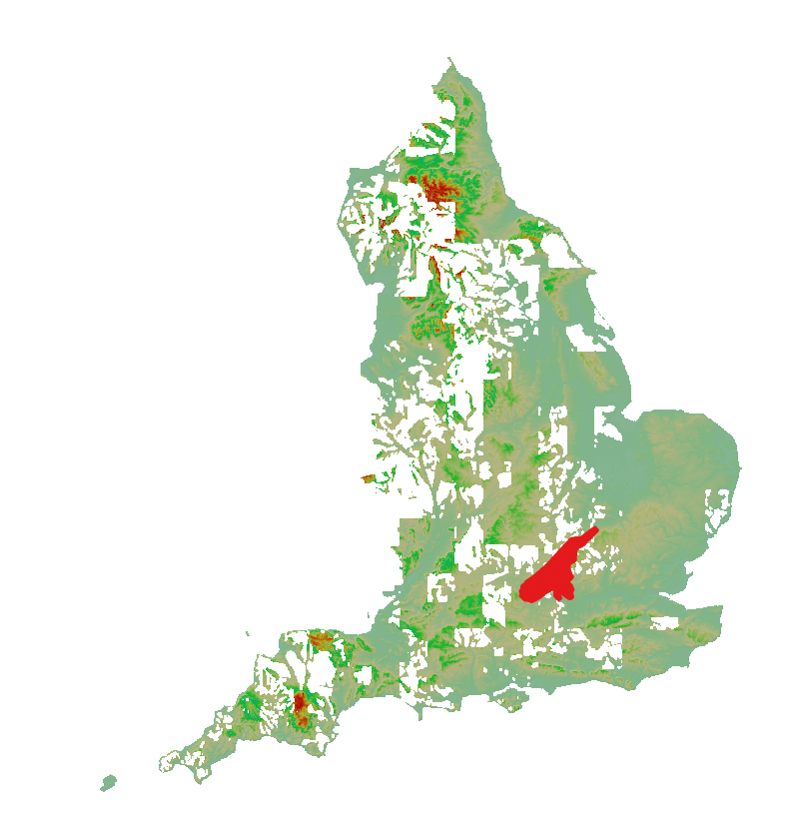
In England, the Environment Agency (EA) has been flying LiDAR surveys since 1998 (before archaeologists had even cottoned on to the fact it was a technique that we could use). This was primarily for the purposes of flood risk mapping, and so focused on low lying areas and coastlines prone to flooding. Since then more and more of the landscape has been flown each year. In 2015 they started to make their data available to the public under the Government’s Open Data strategy, and in November 2016 they announced that the LiDAR surveying was to continue as a “National LiDAR Programme” aiming to get complete coverage of England at 1 m resolution by the end of 2021. How good is that?! As you can see from the map above, up to the end of 2019 a really large proportion of England has already been covered, over 75 % of the survey complete.
You can view the survey results as a nice, neat, easy to use web mapping service (WMS). I think the best place to look at it is on the National Library of Scotland’s “Side by Side” Map viewer: https://maps.nls.uk/geo/explore/side-by-side/#zoom=5&lat=56.00000&lon=-4.00000&layers=1&right=LIDAR_DTM_1m
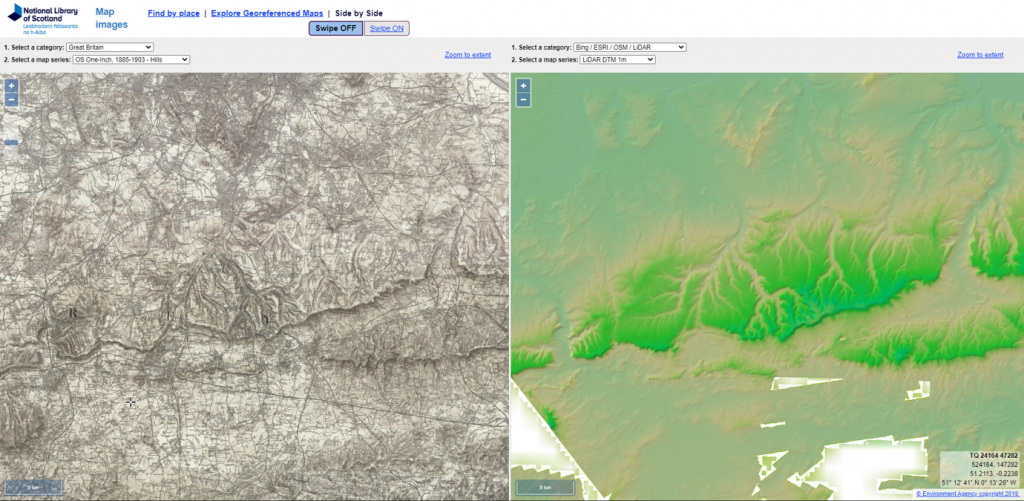
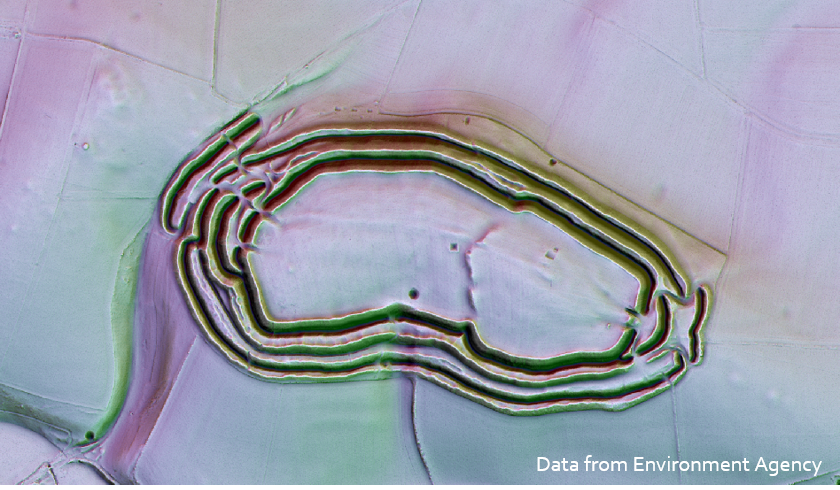
However, if you’re used to looking at the Chilterns data, you might be slightly underwhelmed by the level of detail visible in the WMS. This might in part be down to the lower resolution of the EA data – 1 m pixels vs the Beacons project’s 25 cm pixels – 16 times the detail! But this is largely the result of the “symbology” of the data in the WMS. If you’ve done the “LiDAR Data Vis” tutorial you will already know a bit about this, but the symbology, i.e. the way the data is shown or “visualised”, has a big impact on what is visible. The WMS uses a colour ramp to show height above sea level, together with a subtle Single-Direction Hillshade, whereas on the Beacons of the Past Citizen Science Portal we provide our LiDAR data as a Multi-Direction Hillshade visualisation and a Local Relief Model visualisation.
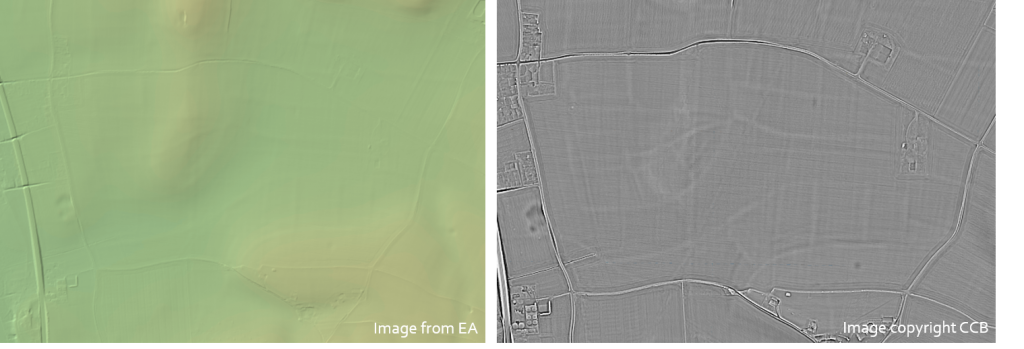
Unfortunately the basic symbology isn’t something that you can edit for the EA WMS – that is set by the data provider. So what we need to do instead is download the data behind the WMS to visualise it ourselves! And that’s exactly what the workshop demonstrated. Using the open source GIS software QGIS, and a piece of software called Relief Visualisation Toolbox for producing the specialist visualisations, I take you through a workflow to find and download your tiles of interest, merge them if you have more than one, visualise the data to bring out maximum archaeological interest, and then view your images in QGIS with free basemaps.
This workshop used English data from the Environment Agency, but the same process will work very similarly with data from other parts of the world. For example, you can see and download data available for Scotland here or for Wales here. The archaeologist Jošt Hobič has collated a fantastic list of sources of LiDAR data from around the world, which you can view here. (Also check out his Twitter feed for fantastic LiDAR images and archaeology videos.)
If you fancy giving this a try, have a watch of the video, check out the PDF of the Powerpoint, and let me know how you get on! Go have a look at your favourite archaeological sites (if they’ve been surveyed), and tweet your images to me @edpev7.
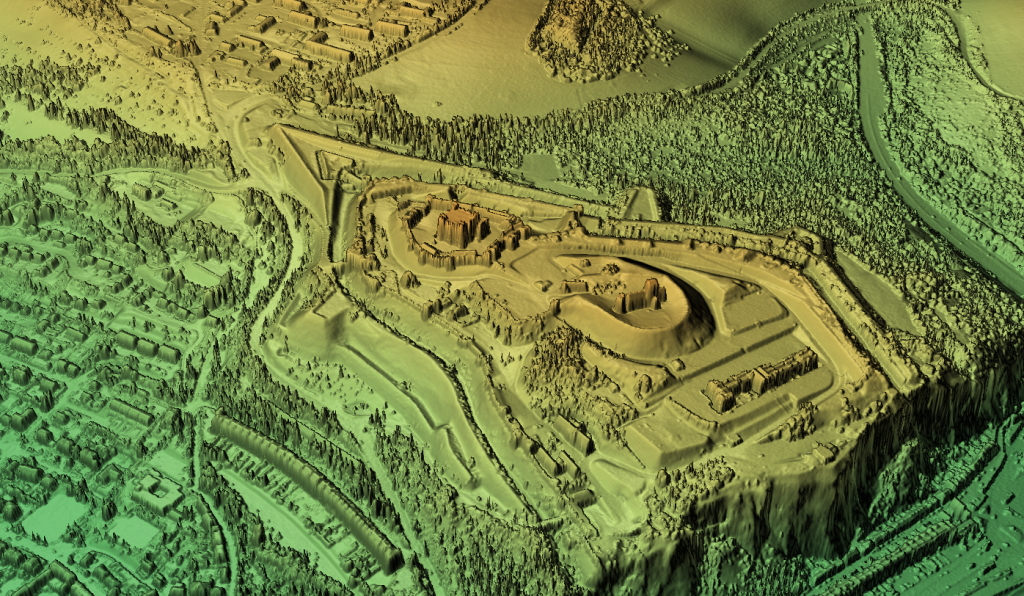
Next time maybe we’ll have a look at 3-dimensional visualisation…!
Hi Ed,
Thank you for an excellent overview of Lidar! I found it most helpful, and have signed up to the Chilterns Beacons Project to access the tutorials.
Thanks Mark! Glad to hear it.
Didn’t mean to log in as Hacienda83 – it is Amanda Eames, have finally got some time to look at the project. Done the tutorials but now a bit anxious at having a go. Where should I start? Really interesting.
Hi Amanda – First thing to say is don’t be nervous! The way the system is set up, your “Citizen Science” spots all get fed to our Reviewer team, who will decide whether they agree with you or not. So it doesn’t matter if you do get something wrong, it will get a second layer of assessment a little way down the line.
Second thing to say is just dive in. If there’s an area you know, perhaps start with that – see how the LiDAR view matches up with your knowledge of the landscape. Or use the scheduled monuments layer to have a look at the various motte and bailey castles, moated sites, barrows, hillforts etc. around the AONB, to see what they look like, before starting to look at the rest of the landscape. There might be things that you then recognise.
Third thing to suggest would be to consider signing up for the live training sessions and mapathons. These are advertised somewhere over here on the right hand side of the page ———>
At the training sessions I’ll be giving more tips on how to read the data and use the portal, and the Mapathons are a great way to chat with other volunteers, share any sites you might be interested in or are struggling with, and just to see what other people have been getting up to. (Or you can get involved on the Forums, if you can’t make the Mapathons.)
Happy searching!