(This blog post features a less archaeological use of the LiDAR data collected by the Beacons of the Past project…orienteering. Over the course of the last few years, the 0.25m resolution terrain modelling possible through LiDAR has been put to good use by the Thames Valley Orienteering Club (TVOC) to produce high-resolution base mapping for use in their navigation events.
Bob Beresford from TVOC tells us more….)
How the Beacons of the Past Project has helped Thames Valley Orienteering Club update and improve their maps.
British Orienteering is the UK organisation that governs orienteering and there are local clubs who organise and run events in their areas. Thames Valley Orienteering Club (TVOC) is the local club for Buckinghamshire and Oxfordshire – covering the area between Oxford and Marlow and includes the Chilterns.
Orienteering is an exciting outdoor adventure sport which involves walking or running whilst navigating around a course using a special, detailed map and sometimes a compass. The aim is to navigate in sequence between a set of control points and decide the best route to complete the course in the quickest time. It does not matter how young, old or fit you are, as you can run, walk or jog the course and progress at your own pace. The orienteering map (below right) looks quite different from the Ordnance Survey map as the section of Penn Wood below illustrates.
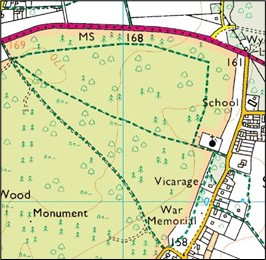
Contains OS data © Crown copyright and database right (2021)
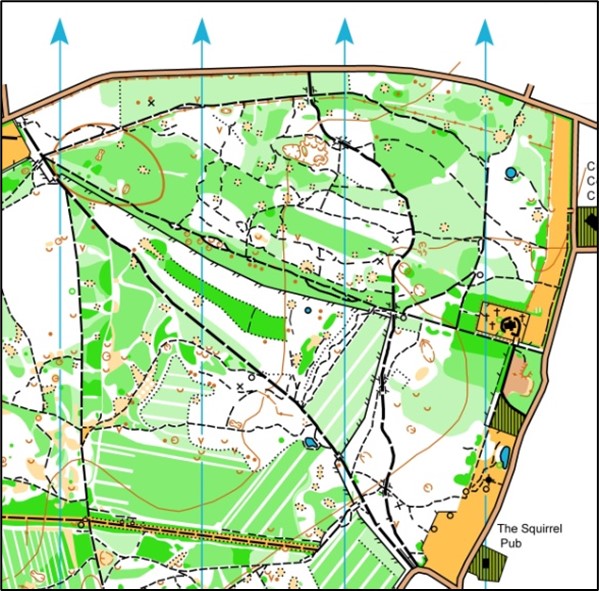
This special map allows the competitor to navigate to the control points using all the features on the map. These include all paths from large to small; open areas shown as yellow or orange; vegetation and forest from white (runnable) to dark green (thick bushes); and features such as depressions and knolls. The maps are very accurate and are drawn at 1:15000 or 1:10000 scales from ground surveys. In the past the orienteering maps were drawn by hand and surveys on the ground, but they are now done using mapping software called OCAD. (Ordnance Survey maps are usually 1:50000 or 1:25000). In recent years, georeferencing of the maps and the availability of LiDAR data from the Environment Agency, has allowed the accuracy to improve using Hill Shading and Vegetation maps, and derivation of contour data. However, the EA LiDAR data does not currently cover all areas, and resolution in many areas is low. All our mapping is done by volunteer mappers, as the cost of using an external mapping supplier is high.
One of our orienteering club members was helping to analyse LiDAR data for the Chilterns ‘Beacons of the Past’ project and noted that the work being done to look for archaeological features was using hill shading maps, which can be useful when drawing Orienteering maps. In particular, the high resolution (0.25m) used in the survey, would provide very accurate terrain modelling.
We approached the Project team and were delighted to be given permission (with some provisos) to use the BotP data to assist in our Orienteering mapping. We were able to define areas we use for orienteering in the Chilterns (for example the woods around Naphill and Bradenham, Hambleden (Culden Faw Estate), and Nettlebed) and Ed Peveler was able to provide the LiDAR data as LAZ files. The files for each of our areas is about 3-5gB which required use of an FTP server arrangement to facilitate transfer.
The OCAD mapping software (developed by a Swiss company) can analyse the LAZ files and produce contours, hill shading and vegetation maps. These analyses can be shown as background maps, so helping to check and modify the existing orienteering map.
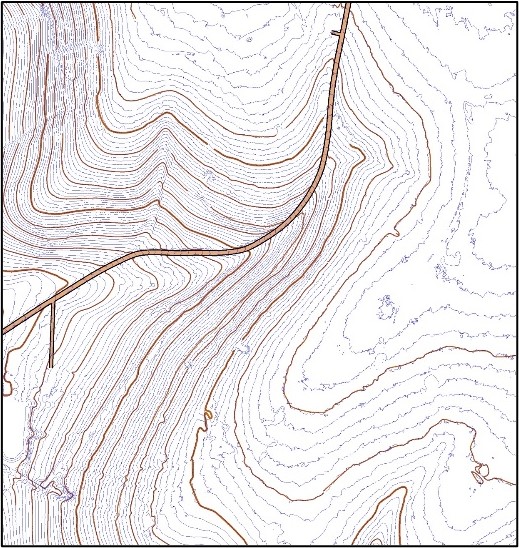
The contour analysis can be done to 1m, but the orienteering maps use 5m contours as standard. The picture shows an area of The Coppice (an area to the east of Bradenham Woods Lane, owned by the National Trust) with the 1m contours in blue and the 5m contours in brown. The contour lines can be smoothed using TPI (Topographic Position Index) and Bezier curves to provide a satisfactory smoothed line. When comparing the 5m contours on our original O map (probably taken from OS maps some time ago) they show reasonable agreement. The 1m contours show some of the many pits and depressions but not as well as the hill shading analysis.
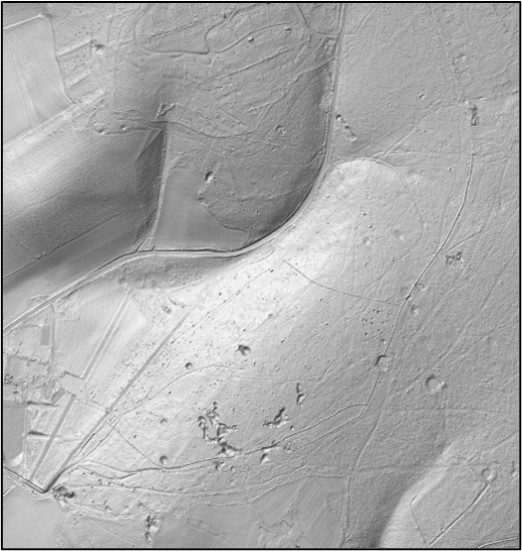
The Coppice – hill shading analysis from BoTP LiDAR data. Image: TVOC
The hill shading analysis can be done with slope shading (default) or slope shading with oblique lighting and can be done with uni-directional light (the angle can be chosen, with default 315deg) or multidirectional (4 images from N, S, E, W merged into one). Often the default settings for the analysis provide good visibility of the ground features.
The picture shows the default hill shading analysis, in the same area as the contour map above. The road is clearly shown and the pits and depressions of various sizes.
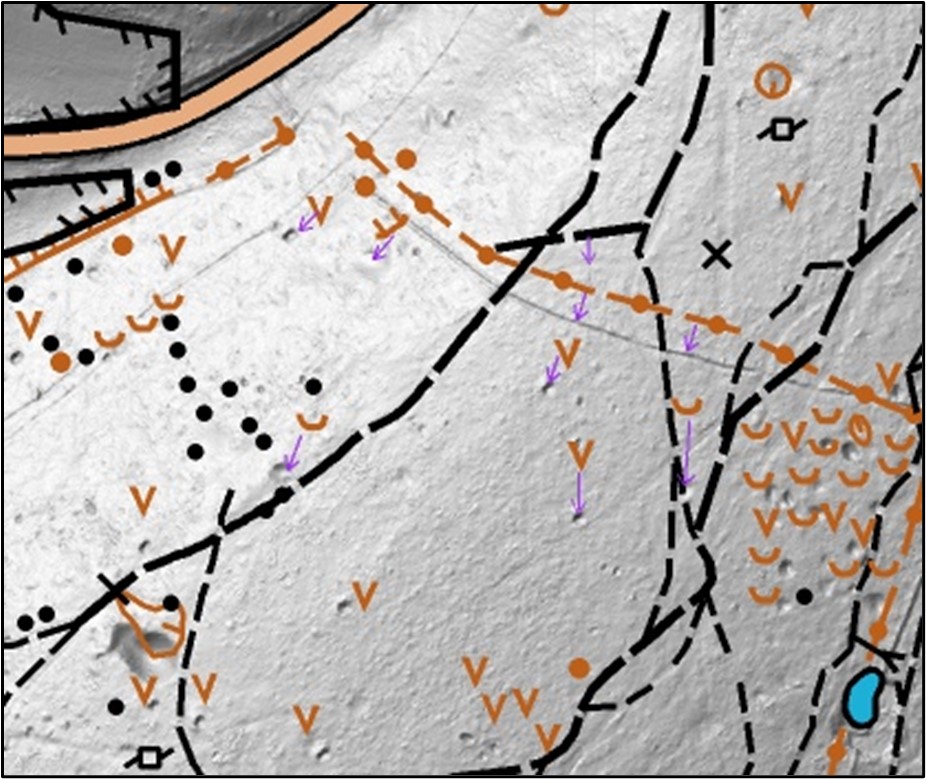
A small section of the map, with the new hill shading, highlights some of the errors we have found in our original map. The original pits (the brown V shape), depressions (brown U shape), and earth walls (old field boundaries, dotted lines with brown circles) have been compared to where they really are on the ground (shown by purple arrows). The software can calculate the error which varies from 10m to 30m in the example.
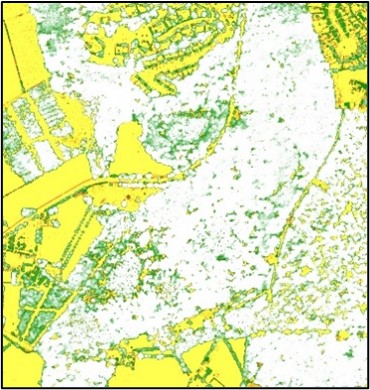
The LiDAR can also provide information on the vegetation by using both the DTM and DSM data to assess the height using colours. In the example yellow is the ground up to 0.1m, green is for heights up to 12m and white is up to 30m. It can be used effectively to find clearings (yellow) in the woods.
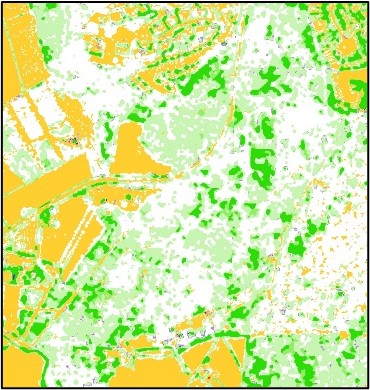
An additional way to look at the model is for vegetation density which analyses data in the range 0-3m. Orange areas are open land, and green areas are vegetation with the darker the green, the thicker the vegetation. This is important for orienteering to decide which areas to run through and which to avoid. Purple areas show areas of brambles.
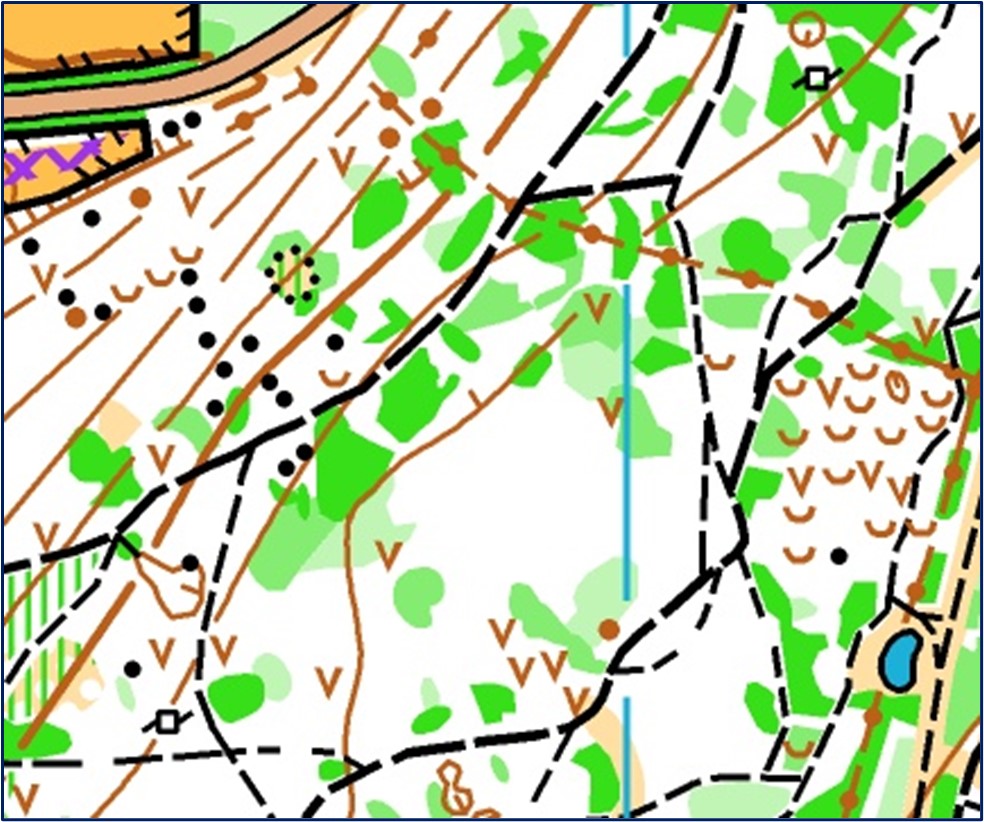
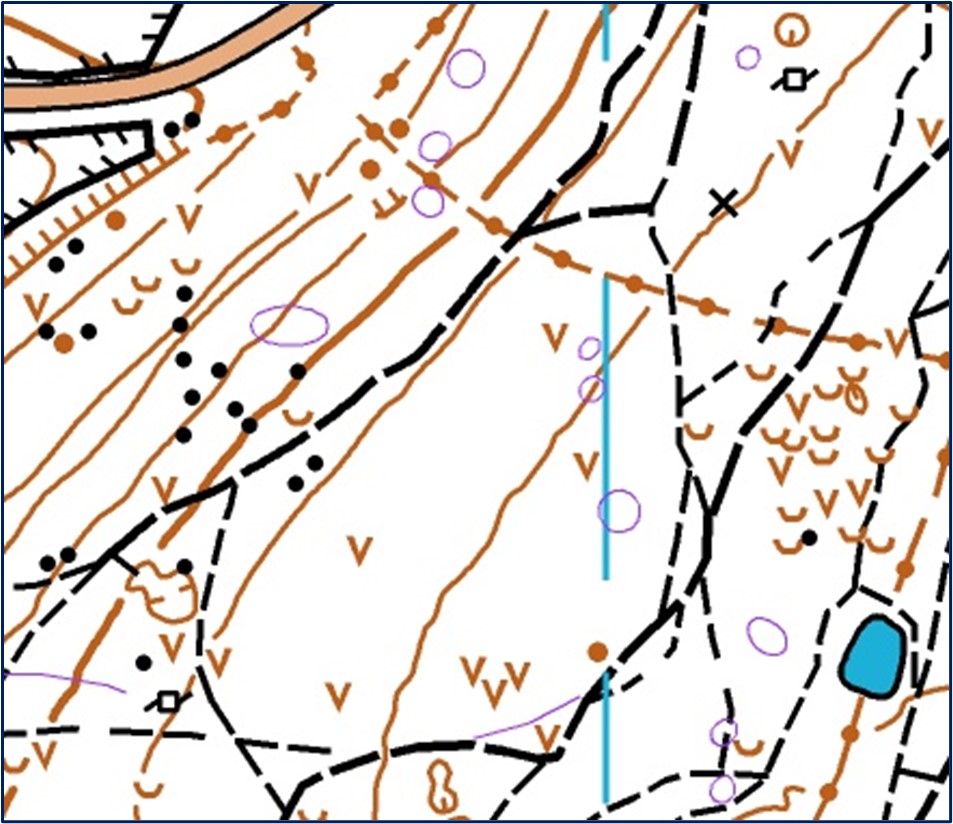
The map updating in Bradenham, The Coppice and Naphill is still in progress and so far, the contours and ground features have been completed. The vegetation update is the next step and this will progress over the next months. The maps below show the original map on the left as used recently without LiDAR and the one on the right shows the progress to date without any vegetation. The purple circles indicate features shown on the hill shading but not on the original map, so are to be investigated – they could be in dense vegetation hence not previously identified. The position and shape of some of the larger features have been changed, on the map, after examination of the hill shading.
Orienteering has, like many sports, been seriously affected by the COVID-19 pandemic and has only recently emerged from the latest lockdown. We hope that the map updates, using this LiDAR, will help to encourage people back to the sport. We are a friendly club and are always looking to recruit new members and parents with children to give the sport a try. So, if you fancy a run around the woods and forests of the Chilterns, then come and have a go. You can visit the website at www.tvoc.org.uk.
Bob Beresford (Thames Valley Orienteering Club)